Information Wants to be Free: Sandettie Lightship and the English Channel
Weather can turn on a dime in the English Channel, and the dreams (and finances) of English Channel swimmers often turn on the weather.
The most important source of information about that weather is a 156-foot lightvessel called Sandettie, which serves as both a floating lighthouse and a weather station.
Sandettie collects a variety of important meteorological data - air and sea temperatures, wind speed and direction, wave height and period, humidity, and barometric pressure. These data are then fed back to the UK Met Office, who publish the most recent 24 hours’ of observations on their website.
Anything before the last 24 hours are what the Met Office call “chargeable data” - at the rate of £6800 per 10 years, per two elements (e.g., air temp & sea temp). According to the today’s exchange rate, that converts to no less than $11,575 USD.
LOL! (And yes, I actually requested a quote from the Met Office.)
Just sayin’: In the US, quality-controlled meteorological data are available from NOAA’s National Data Buoy Center - for free.
Data on historical air and sea temperatures (going back to 2004) are available from the Channel Swimming & Piloting Federation, in the form of interactive charts. Thanks to CS&PF tech whiz Boris Mavra, these charts are automatically updated from the Met Office’s recent observations table.
The CS&PF charts are pretty slick, but personally I’d rather have the raw data to play around with. Not just air & sea temps, but also the wind and the waves. The raw data allow one compute (among other things) summary statistics - e.g., What’s the typical sea temp in the third week of August (averaged across many years)?
But clearly, my curiosity isn’t worth $20,000+ (extrapolating the Met Office’s rate for two elements). So what am I to do?
Other sources of weather data include commercial (non-government) weather services and websites - you can probably think of a few. I managed to find one such website with what appears to be more than 10 years of Sandettie data (going back to June 19, 2004 - same start date as the CS&PF data). All freely and publicly accessible.
Unfortunately, these data are formatted rather inconveniently - one day at a time, in HTML tables. Ugh! You could_ _sit there all day, pointing, clicking, copying, and pasting into Excel, for each one of the 3655 days between June 19, 2004 and today. That would be a ridiculous way to spend a day, but it’s not inconceivable.
_Or…, _you could program a computer to do it for you. The result? A comma-delimited 81,901-row data-set with hourly observations on eight variables:
- air temperature (degrees Celsius)
- sea temperature (degrees Celsius)
- humidity (percent)
- wind direction (16-level factor: N, NNW, NW, WNW, W, etc.)
- wind speed (knots)
- wave period (seconds)
- wave height (meters)
- barometric pressure (hPa)
Here’s the compressed .CSV for your downloading pleasure:
- Sandettie Lightship data: June 19, 2004 - June 22, 2014 (789 KB zip file)
I’ve inspected the data for any gross integrity issues, but have made no additional effort (thus far) to “clean” it of anomalies. As the CS&PF note regarding their own Sandettie data-set:
Data quality: it is easy to see that there are glitches in the way station sensors work or the way they report the measurements. We are planning to clean the records in the near future, but for now we rely on readers’ intelligence in interpreting the feeds. We all know North Sea does not freeze in one hour and 100 mph winds in the middle of the summer are very unlikely!
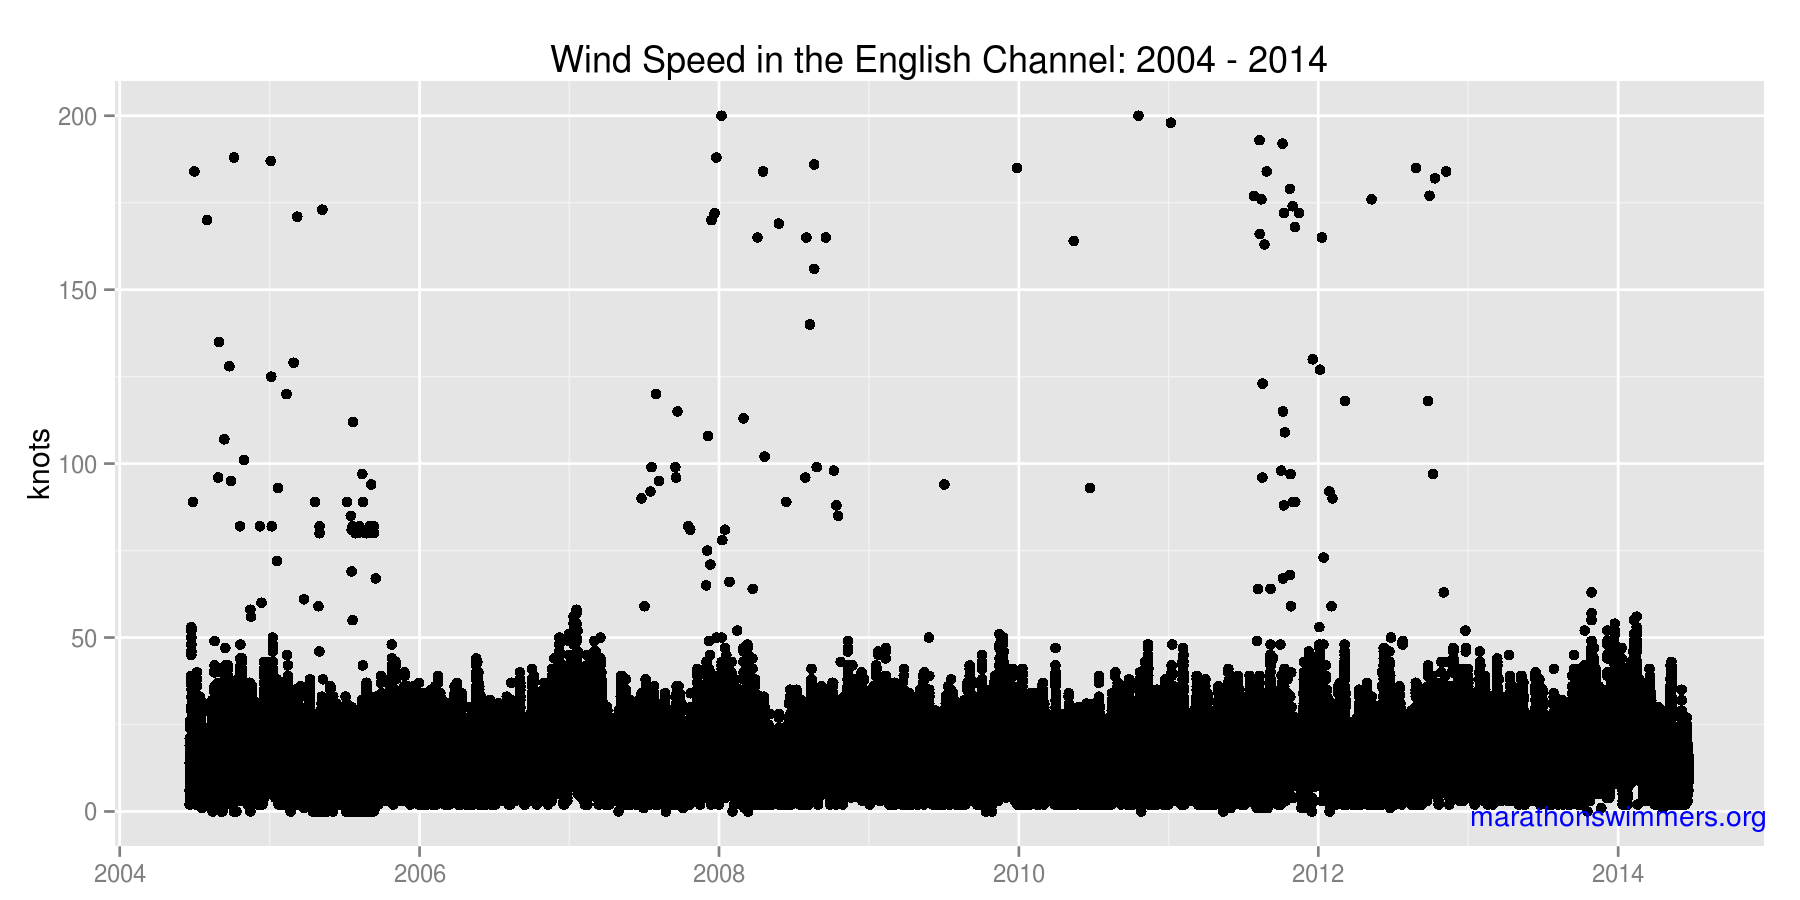
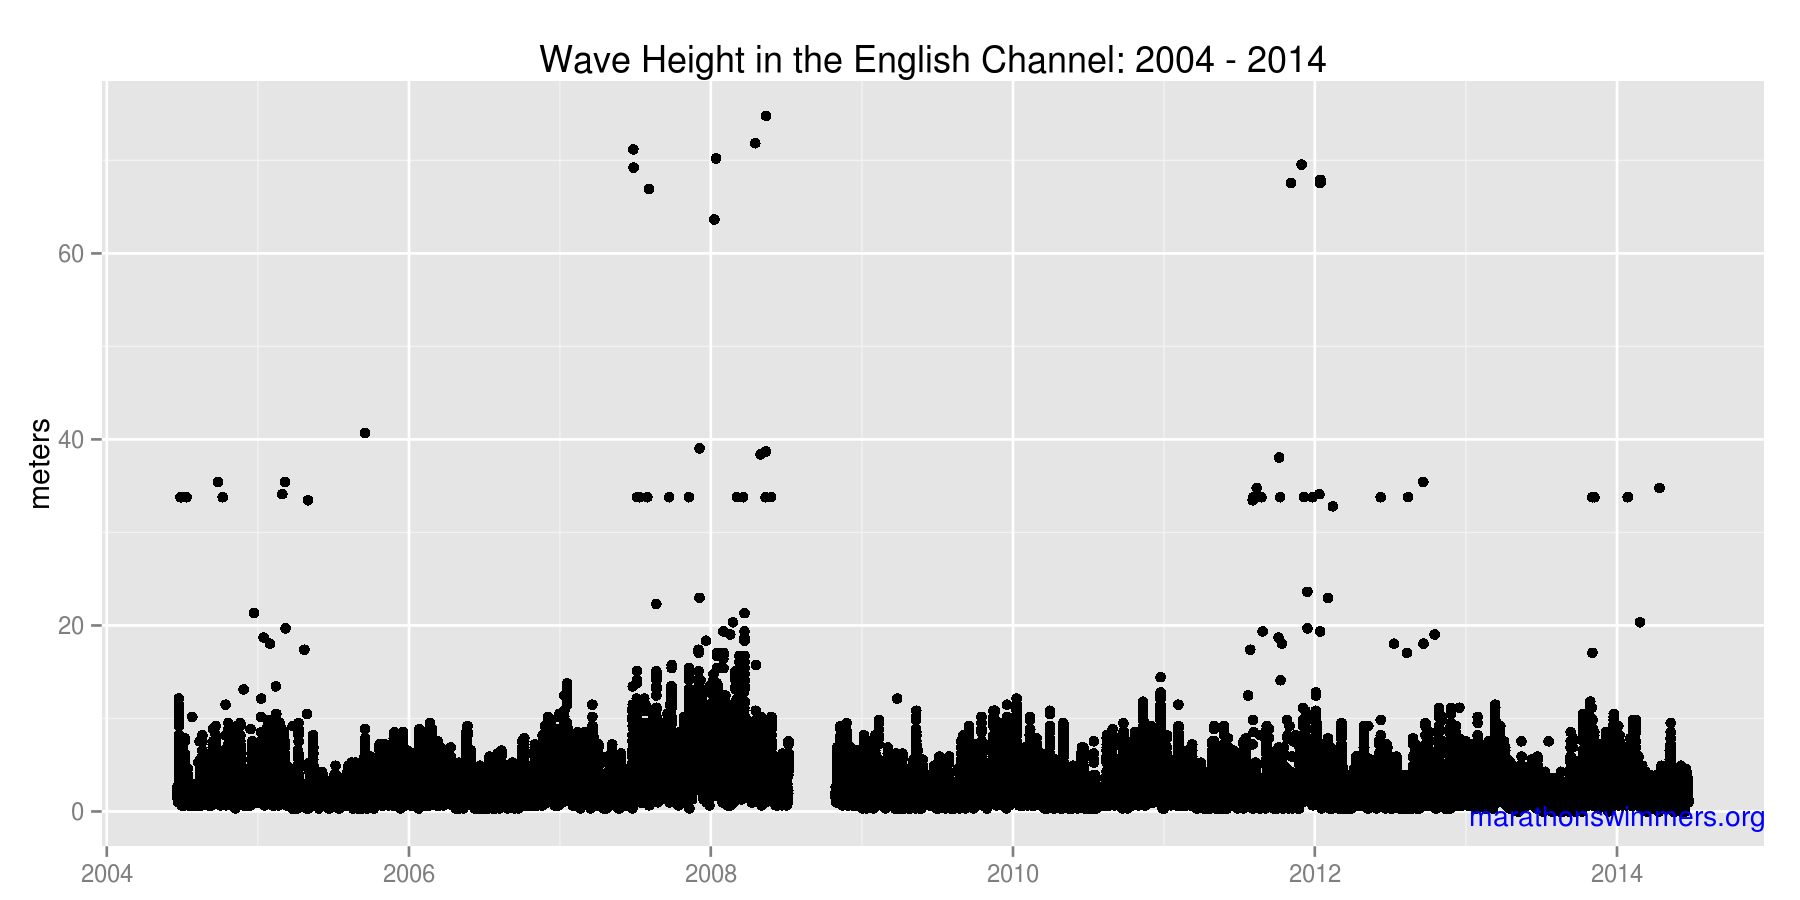
There are definitely some anomalies (see charts below), but they appear fairly normally distributed. So, any subsequent “cleaning” should be reasonably straightforward.
These charts aren’t meant to be taken too seriously (they each required just a single line of R code) - just as a first step in exploring and validating an interesting data-set.
Click any to enlarge:
Actually, relatively few anomalies, considering this represents nearly 82,000 observations!
The next chart shows the same data as above, but I’ve zoomed-in the Y-axis to eliminate the most extreme anomalies.
Again, the next chart shows the same data as above, just with a zoomed-in Y-axis.
Many thanks to ggplot2 package for R, which I used to create these charts.
Important Note: Technically, because I did not obtain these data directly from the UK Met Office, I can make absolutely no guarantees about their integrity or authenticity. However, I will say that subjectively speaking, they “look right.”
Another Important Note: If these data are authentic, then they are considered to contain public sector information licensed under the UK Open Government License v1.0.
A Final Important Note: As far as I know, the extraction (“scraping”) of the data from the third-party weather service did not violate its Terms of Service, which explicitly permit using the data for personal, non-commercial purposes. And I define this blog post as a personal, non-commercial purpose.


