Water temperature in the Catalina Channel
There are 14 years of publicly available data for the surface water temperature in the Catalina (a.k.a. San Pedro) Channel - via CDIP. Unfortunately, that’s all it is - data. No summary statistics, no long-term charts - nothing particularly useful if you’re just looking for a simple, big-picture view of trends and cycles in sea temperature (perhaps to inform your upcoming swim across the channel).
So I decided to make one myself:

NOAA buoys take readings every 30 minutes. Over 14 years, that works out to almost 239,000 observations. Don’t try this on an old computer! For a smoother line, I calculated a weekly average. Same data - just prettier.
Summary Statistics by Day of Year
Sea temperature varies by season, but there are also year-to-year variations. In 2010, for example, the Catalina Channel was unusually cool (even in summer). In 2006 it was unusually warm. Perhaps you’ve wondered: What is the typical water temperature on a given day of the year? If your swim is scheduled for August 15, what is the average water temperature on August 15, averaged across all years?
To answer that question, I made this chart:

Most Catalina swims take place in summer and early fall (not winter or spring), so here’s a zoomed version of the same data, for the swim season only:
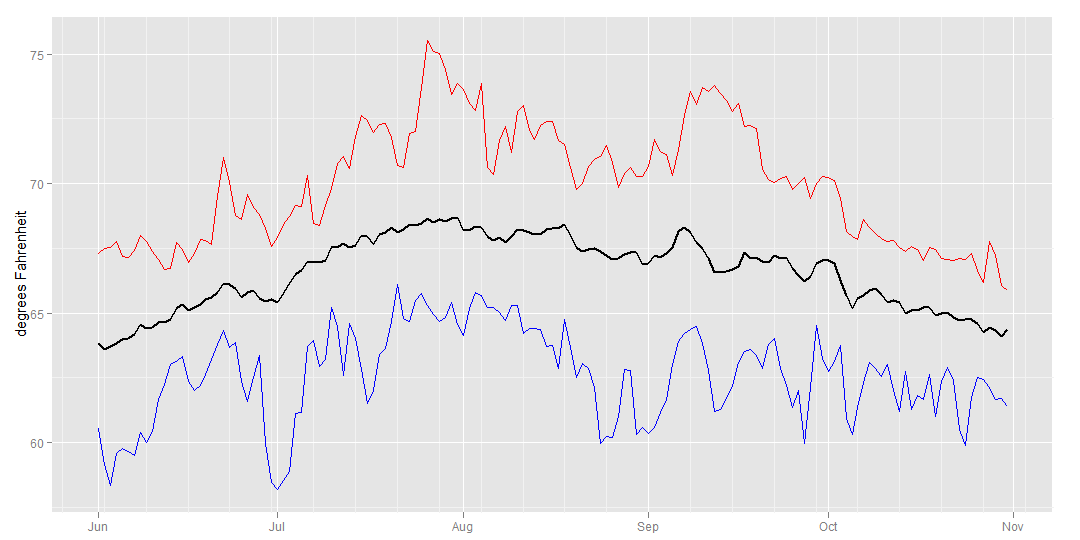
So, water temps in the Catalina Channel tend to peak around August 1, and remain more or less steady through the first week of September. But even in early June and late October, the water is still “warm” by English Channel standards.
Note: It’s important to remember that surface water temps in Southern California tend to drop a few degrees as one approaches the coast, due to upwelling from the steeply sloping ocean bottom. My understanding is that this tends to happen about 3 miles from shore. So, if the buoy reading (6.5 miles offshore) is 63 degrees, the actual surface temp could actually be sub-60 during the last part of your swim.